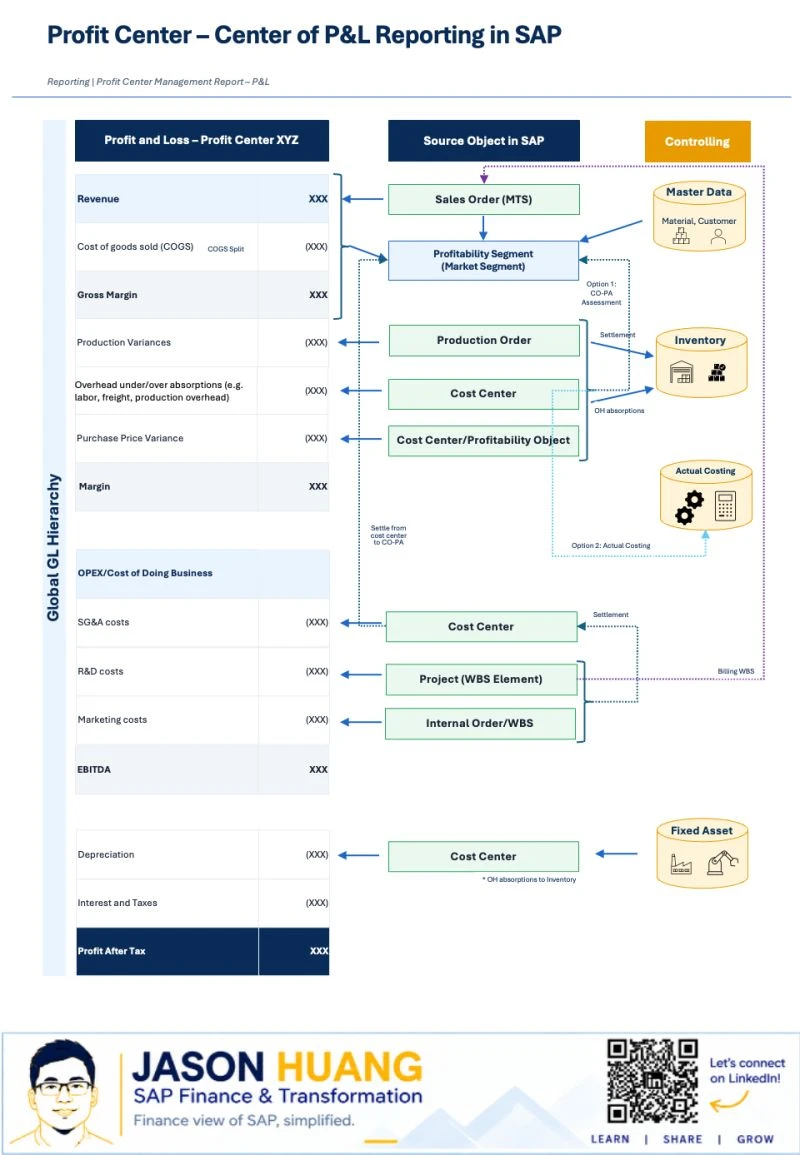
SAP profit center P&L reporting starts with the question “which SAP object feeds which line of the P&L?”. This diagram lays a profit center income statement (Profit Center XYZ) next to the source objects that supply each line: sales orders, production orders, cost centers, WBS elements, internal orders and fixed assets.
What This Profit Center P&L Diagram Covers
The left side of the diagram is a profit and loss statement for “Profit Center XYZ”, running from Revenue down to Profit After Tax and labelled “Global GL Hierarchy”. The middle column, “Source Object in SAP”, shows the object behind each group of lines. The right column, “Controlling”, shows the supporting master data and the Controlling mechanisms (inventory, actual costing, CO-PA assessment and settlement) that tie them together.
All amounts are placeholders (XXX), so the diagram is a design map for finance and controlling teams rather than a report with real values. It does not state whether it applies to ECC or S/4HANA.
Gross Margin: Sales Order and Profitability Segment
The first block of the P&L, Revenue, Cost of goods sold (COGS) and Gross Margin, is fed by the Sales Order (MTS), meaning make-to-stock, and by the Profitability Segment (Market Segment). The COGS line carries a “COGS Split” note.
Master Data (Material, Customer) feeds both the sales order and the profitability segment. A purple dotted line labelled “Billing WBS” links the project (WBS element) side back to the sales order, showing that project billing can also reach revenue.
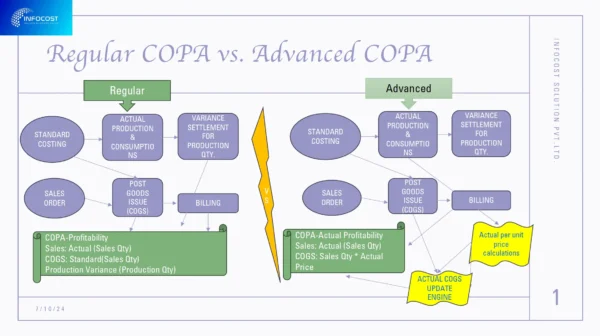
For a closer look at profitability analysis itself, see Regular vs Advanced COPA in SAP.
Manufacturing Variances and Absorptions Below Gross Margin
Between Gross Margin and Margin, the diagram lists three lines, each with its own source object:
- Production Variances come from the Production Order.
- Overhead under/over absorptions (for example labor, freight and production overhead) come from a Cost Center.
- Purchase Price Variance comes from a Cost Center/Profitability Object.
The production order, the cost center and the cost center/profitability object are grouped by a bracket. From that group, the diagram shows arrows to Inventory (labelled “OH absorptions”) and to the Controlling options described below. A footnote reads “OH absorptions to Inventory”. Manufacturing cost flows in general are covered in SAP Manufacturing Cost Management Process Flowchart.
OPEX: Cost Centers, Projects and Internal Orders
The operating expense block (“OPEX/Cost of Doing Business”) maps each cost type to a source object:
- SG&A costs come from a Cost Center.
- R&D costs come from a Project (WBS Element).
- Marketing costs come from an Internal Order/WBS.
Two dotted arrows labelled “Settlement” and “Settle from cost center to CO-PA” show how costs collected on projects and orders are settled to the cost center and onward to the profitability segment. The subtotal at the bottom of this block is EBITDA. Project structures and settlement are discussed in SAP PS for Capital Projects.
Depreciation, Interest, Taxes and Profit After Tax
Below EBITDA, Depreciation comes from a Cost Center that receives its values from Fixed Asset master data. Interest and Taxes are shown as a P&L line, but the diagram does not name a source object for them. The statement ends with Profit After Tax. For the asset side, see SAP FI-AA Asset Depreciation Business Process Flow.
Controlling Options: CO-PA Assessment vs Actual Costing
The right-hand “Controlling” column presents two options for carrying cost-center and production results into profitability and inventory valuation:
- Option 1: CO-PA Assessment, a dotted path from the cost center and production-order group up to the Profitability Segment.
- Option 2: Actual Costing, a light-blue dotted path to the “Actual Costing” object, which is connected with Inventory.
The diagram does not recommend one option over the other.
P&L Line to Source Object Mapping
| P&L line | Source object in the diagram | Note |
|---|---|---|
| Revenue | Sales Order (MTS) / Profitability Segment | Master Data (Material, Customer) feeds the segment |
| Cost of goods sold (COGS) | Sales Order (MTS) / Profitability Segment | Marked “COGS Split” |
| Production Variances | Production Order | Group also linked to Inventory |
| Overhead under/over absorptions | Cost Center | Examples: labor, freight, production overhead |
| Purchase Price Variance | Cost Center/Profitability Object | — |
| SG&A costs | Cost Center | Receives settlement; settled onward to CO-PA |
| R&D costs | Project (WBS Element) | “Billing WBS” link to the sales order |
| Marketing costs | Internal Order/WBS | — |
| Depreciation | Cost Center | Values come from Fixed Asset |
| Interest and Taxes | Not shown | No source object in the diagram |
Additional SAP Notes (Not Shown in the Diagram)
The points below are general SAP knowledge added for context. They are not part of the original image:
- Production order variances are typically settled with CO88, internal orders with KO88, and WBS elements with CJ88.
- Depreciation values reach cost centers through the periodic asset depreciation run (AFAB).
- Actual costing is run through the Material Ledger (for example with CKMLCP).
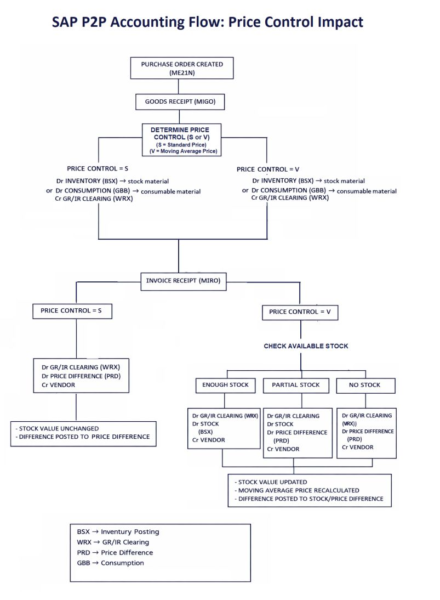
- When a material uses standard price control, an invoice price difference posts to a price difference account instead of changing the stock value.
Key Takeaways
- A profit center P&L is only as good as the source objects that feed it: sales orders, production orders, cost centers, WBS elements, internal orders and fixed assets.
- Gross margin comes from the sales order and the profitability segment; variances and absorptions sit between gross margin and margin.
- OPEX lines (SG&A, R&D, marketing) map to cost centers, projects and internal orders, with settlement tying them together.
- The diagram shows two Controlling options, CO-PA assessment and actual costing, for carrying results into profitability and inventory.
- Interest and taxes have no source object in the diagram.
Diagram as Text
Show the diagram as plain text
Profit and Loss – Profit Center XYZ (Global GL Hierarchy): Revenue (XXX); Cost of goods sold (COGS) with “COGS Split” (XXX); Gross Margin (XXX); Production Variances (XXX); Overhead under/over absorptions, e.g. labor, freight, production overhead (XXX); Purchase Price Variance (XXX); Margin (XXX); OPEX/Cost of Doing Business: SG&A costs (XXX), R&D costs (XXX), Marketing costs (XXX); EBITDA (XXX); Depreciation (XXX); Interest and Taxes (XXX); Profit After Tax (XXX).
Source objects in SAP: Sales Order (MTS); Profitability Segment (Market Segment); Production Order; Cost Center; Cost Center/Profitability Object; Cost Center (SG&A); Project (WBS Element); Internal Order/WBS; Cost Center (Depreciation).
Controlling objects and labels: Master Data (Material, Customer); Inventory; Actual Costing; Fixed Asset; Option 1: CO-PA Assessment; Option 2: Actual Costing; Settlement; Settle from cost center to CO-PA; OH absorptions; Billing WBS; footnote “OH absorptions to Inventory”.